Quick Facts
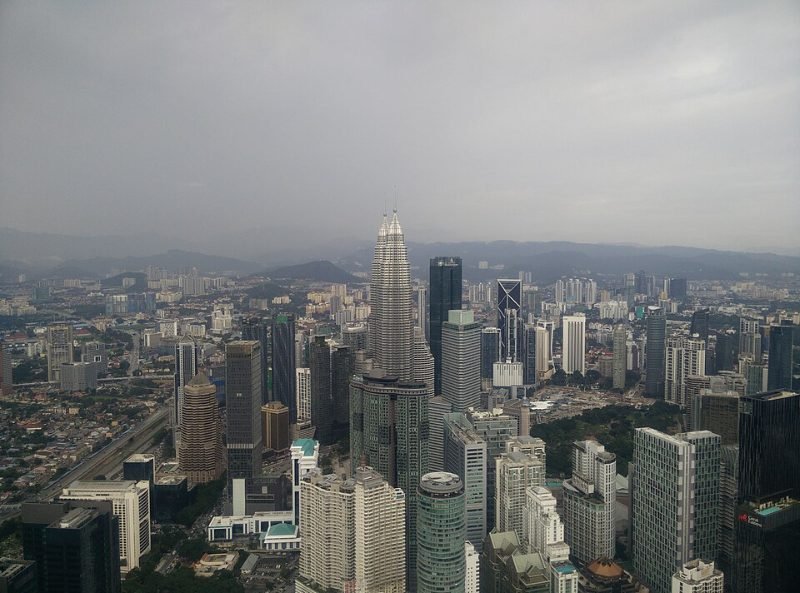
Understanding Energy Costs by Building Grade helps tenants and businesses budget with confidence. When comparing Energy Costs by Building Grade, always check whether figures are gross or net of service charges. Tracking Energy Costs by Building Grade over time makes it easier to time a renewal or relocation. Benchmarking Energy Costs by Building Grade across buildings keeps fit-out and headcount plans realistic. In short, Energy Costs by Building Grade reward tenants who do their homework before signing.
- Topic: Energy Costs by Building Grade: What Older KL Towers Really Cost You
- Market Context: Greater Kuala Lumpur, 2026
- Applicable to: Corporate occupiers, business owners, SMEs and MNCs making office-related decisions in Malaysia
- Current Market Condition: Tenant-favourable — citywide prime vacancy ~22%, minimal new supply in 2026
Energy Costs by Building Grade: What Older KL Towers Really Cost You
Quick Answer: A KL office’s energy bill is written by the building’s vintage before your first appliance switches on: cooling dominates the load in a tropical tower, and the efficiency gap between a modern certified plant and a 1990s one shows up in three tenant-facing lines — your own metered electricity (the efficient envelope-and-plant building can run materially leaner per square foot), the service charge’s energy component (the largest swing factor in its drift), and the after-hours air-conditioning tariff (RM30–45/zone-hour in efficient stock vs RM60–80 in ageing plants — the gap at its most visible). With Malaysian electricity tariffs restructured upward in recent years, the grade-by-grade gap compounds annually — and this guide shows where it hides, how to audit it at shortlist, and what it’s worth in your comparison table.
There’s a number missing from every rent comparison this market produces: the building’s appetite. Two towers at identical psf can differ by a meaningful margin in what they cost to keep cool — the same tropical sun falling on a 2019 envelope with a sequenced chiller plant versus a 1995 curtain wall with the original machines — and the difference lands on tenants through routes most comparisons never itemise. Office energy costs by building grade in Malaysia are knowable, auditable and increasingly material as tariffs climb; this guide maps the physics to the invoices, prices the gap honestly, and supplies the shortlist audit that puts the missing number back in the table.
The Physics: Why the Grade Gap Exists
A KL office tower is, energetically, a refrigerator fighting the tropics — air-conditioning routinely accounts for half or more of a commercial building’s electricity in this climate — and the fight’s efficiency is set by hardware decided decades before your viewing: the envelope (glazing performance, shading, the façade’s solar load — the difference between a high-performance curtain wall and a 1990s one is heat that must be removed at your collective expense, every daylight hour, forever); the plant (modern high-efficiency chillers, variable-speed drives and sequenced operation versus ageing fixed-speed machines running flat-out — efficiency differences that compound across every cooling hour); the controls (the BMS-and-analytics layer that matches output to actual load and occupancy versus the schedule that cools empty floors); and the zoning granularity that decides whether one team’s evening costs one zone or half a floor. Certification is, at bottom, third-party evidence that these layers were engineered — which is why the plaque correlates with the bills.
Where the Gap Lands: The Three Tenant-Facing Lines
Line one — your own meter. The within-demise consumption your tenancy pays directly: partly your own behaviour (equipment, lighting density, hours), partly the building’s gift or tax — the supplementary cooling an under-served floor forces you to install and run, the solar load your blinds fight, the base-building systems’ share metered through to you. Efficient stock consistently lets the same operation run leaner; the honest sizing of the effect varies by building pair, which is why the audit below asks for real numbers rather than reciting a universal percentage.
Line two — the service charge’s energy core. Common-area and central-plant electricity is the service charge’s largest swing component, and it’s where tariff rises enter every tenant’s costs whether or not their own meter moved: Malaysia’s electricity tariff structure was revised upward and restructured for commercial users in recent cycles, and each adjustment flows through ageing plants at full force while optimised buildings absorb part of it through efficiency. The observable consequence across our files: service-charge trajectories diverging by grade — the modern building’s annual drift running visibly slower than the ageing peer’s — which across a multi-year term quietly outweighs small headline-rent differences. Knight Frank’s market commentary has flagged exactly this pressure on older stock’s operating economics; the two-tier market has an energy chapter.
Line three — the after-hours tariff, the gap’s loudest exhibit. The per-zone-hour charge for evening cooling is grade-by-grade economics in one number: efficient finely-zoned plants charge RM30–45, ageing coarse-zoned ones RM60–80 — and for late-working profiles (the deal teams, the engineering hubs, the follow-the-sun operations) the differential compounds into five figures annually before any negotiation. The same vintage logic sets what an evening hour even buys: the modern building cools your zone; the old one cools your neighbours too, and bills you for the privilege.
The Audit: Putting the Number in Your Comparison
The shortlist method, four asks per building: (1) The intensity figure — kWh/m²/year for the building; well-run and certified stock produces it readily, and the request’s reception is itself diagnostic. (2) Three years of service-charge history — the trajectory, not the snapshot, with the energy component identified; this is the grade gap’s financial record, already written. (3) The after-hours schedule and zoning map — the tariff, the minimum booking, and the smallest independently-coolable zone on your floor. (4) The tenant references — the sitting tenant’s candid answer to “what do evenings actually cost you?” beats every brochure. Then build the comparison properly: the TOC model with an energy row populated from the answers — your projected metered consumption at each building’s realistic performance, the service-charge drift at each building’s demonstrated trajectory, your after-hours pattern at each building’s actual tariff — and the “identical psf” towers separate on the page the way they were always going to separate on the invoices.
A Worked Comparison: The RM0.40 That Wasn’t a Premium
A composite 11,000 sq ft professional tenant with a genuine evening culture, two finalists: an ageing Grade A at RM5.60 and a certified 2018 tower at RM6.00. The energy audit’s findings, annualised: after-hours — the tenant’s measured ~640 zone-hours/year at RM68 versus RM36 = RM43,500 vs RM23,000 (RM20,500 gap); service charge — histories showing the old tower’s charge rising at roughly twice the new one’s pace, modelled conservatively as a RM9,000 year-three differential; within-demise — the old floor’s solar load and supplementary-cooling reality estimated by the M&E consultant at RM8,000–12,000 a year against the new envelope. Total energy-line gap: ≈RM38,000–42,000 annually — against the headline premium’s RM44,000 (RM0.40 × 11,000). The “cheaper” building was a rounding error from a tie before counting the certification’s reporting value, the comfort scores or the flight-to-quality exit risk on the older asset — and the tenant took the 2018 tower with the energy table stapled to the approval paper. The moral this cluster keeps proving: vintage is a price, whether or not the rent schedule prints it.
The Mitigations: When You’re Staying in Older Stock
The honest playbook for the value-tier tenant (a legitimate choice this site defends): negotiate the energy terms with the building’s reality priced in — the after-hours tariff argued from the cost-recovery principle, service-charge transparency and review rights in the lease drafting, and the single-AHU late-zone layout designed at fit-out; control your own demise (efficient lighting, sensible equipment, blinds and film on the solar-loaded façade — the within-meter line is partly yours everywhere); and read the landlord’s capex trajectory — the ageing tower mid-retrofit (new chillers, BMS upgrades, the repositioning wave the market’s incentives are encouraging) is a different energy bet than the harvested asset, and the retrofit schedule belongs in your renewal conversation as both diligence and leverage.
The Tariff Context: Why the Gap Keeps Widening
The macro layer that turns the grade gap from static fact into compounding trend: Malaysia’s commercial electricity pricing has been moving through structural change — tariff schedules restructured, imbalance-cost pass-through mechanisms adjusting charges on regular cycles, and the broader policy direction (subsidy rationalisation, time-of-use signals) pointing the same way every regional grid’s economics point: upward and more variable. The tenant consequences by building grade run asymmetrically. The efficient building absorbs: lower consumption per square foot means each tariff adjustment lands on a smaller base, the modern plant’s controls can shift load away from expensive periods where time-of-use structures reward it, and green-procurement options (the sourcing lever) hedge the trajectory partially. The ageing building amplifies: the same adjustments hit a larger consumption base, the fixed-speed plant can’t load-shift, and the pass-through arrives in your service charge whole. The arithmetic of divergence: if two buildings differ 30% in energy intensity today, every percentage point of tariff increase widens their ringgit gap by the same proportion — the grade gap is a multiplier sitting on a rising base, which is why the worked comparisons in this guide age in only one direction. The lease-drafting consequence: for terms of three-plus years in older stock, the tariff trajectory belongs in your modelling at signing (the TOC’s energy row run at today’s rates and a plausibly-escalated scenario), and the service-charge transparency clauses become the instrument that lets you watch the pass-through honestly rather than discover it annually. None of this requires predicting energy policy — only noticing its direction, which the last several adjustment cycles have made unambiguous, and pricing buildings as if the trend continues. The efficient tower is, among everything else this cluster documents, a tariff hedge with a lobby.
Building Facilities Considerations
When evaluating buildings in the Greater KL market, the facilities criteria most consistently relevant to occupiers are: internet connectivity and power reliability, security and access control, end-of-trip facilities (showers, lockers, bicycle storage), F&B proximity, and parking provision. Grade A buildings across the districts covered in this guide generally meet high standards on all these criteria — specific building-level verification remains advisable before signing.
Key Insights
- Practical application: The information in this guide has direct application to office-related decisions in the Greater KL market — from building selection to lease negotiation and occupier strategy.
- Current relevance: All analysis reflects 2026 market conditions and current professional practice in Malaysia.
- Decision support: Use this guide alongside specific building or landlord due diligence — general market knowledge combines with property-specific data to support better decisions.
Common Pitfalls and Limitations
- Generic assumptions: Market data and benchmarks in this guide represent averages — specific buildings, landlords and transactions may vary significantly from market norms.
- Timing sensitivity: KL’s office market conditions evolve — verify current data with a specialist advisor before making final decisions.
- Over-reliance on single metrics: No single data point (rental rate, vacancy, specification) captures the full picture — holistic evaluation across multiple factors produces better outcomes.
Who This Guide Is For
- Business owners and executives making office-related decisions for Malaysian operations
- Corporate real estate managers requiring current market context for decision support
- CFOs and finance directors reviewing occupancy cost and lease financial implications
- Advisors preparing analysis or recommendations for clients with Malaysia office requirements
For official market and investment context, see MITI and MIDA. For practical leasing steps, read our guide on how to rent office space in KLCC, which complements this overview of Energy Costs by Building Grade.
Frequently Asked Questions
Do older office buildings really cost more in energy?Materially — older envelopes admit more heat, ageing plants remove it less efficiently, and coarse zoning wastes evening cooling; the gap reaches tenants through their own meters, service-charge drift and after-hours tariffs that run roughly double efficient stock’s rates.
How much are after-hours air-conditioning charges by building age?Roughly RM30–45 per zone-hour in modern efficient buildings versus RM60–80 in ageing plants — the grade gap’s most visible single number, and a five-figure annual line for late-working tenants.
How do I audit a building’s energy costs before leasing?Four asks: the kWh/m²/year intensity figure, three years of service-charge history, the after-hours tariff and zoning map, and a sitting tenant’s candid evening-cost answer — then model your own pattern at each building’s real numbers inside the TOC comparison.
Do rising electricity tariffs affect tenants directly?Yes, through every line — tariff restructuring flows into your meter, the service charge’s energy core and after-hours rates, with efficient buildings absorbing part of each rise and ageing ones passing it through whole.
Can anything reduce energy costs in an older building?Partly — negotiated after-hours terms, single-zone late layouts, efficient fit-out specifications and solar-control measures help; the envelope and plant remain the landlord’s, which is why the retrofit-trajectory question belongs in your renewal diligence.
The Bottom Line
Every tower has two rents: the one on the schedule and the one the chillers write monthly — and only the first appears in the brochure comparison. Ask for the intensity figure, read the service-charge trajectory, price your evenings at each building’s real tariff, and let the energy row decide what the psf row concealed: in a cooling-dominated climate with rising tariffs, vintage is the comparison’s most honest column.
Want the energy audit run on your shortlist? Enquire now — the intensity requests, tariff comparisons and TOC energy modelling are standard on every search.
Related Articles
- KL Office Market Outlook 2026
- Tenant’s Market: Incentives Landlords Are Offering in 2026
- Grade A vs Grade B Office Performance in Malaysia
- KLCC vs Bangsar South vs Mid Valley
- How to Choose an Office Location in Greater KL
This article is part of our complete guide to Office Space for Rent in KLCC — explore the full hub for everything on pricing, buildings, leasing and more.